Cartographic visualizations using LeafletJS

We talk about JavaScript. Each month in Warsaw, Poland.

Cartographic visualizations using LeafletJS

Autor: Wiktor Niesiobędzki

CC-BY-SA 3.0

Who I am

  • Computer geek
  • Bike maniac
  • OpenStreetMap freak
  • Amateur photographer

Who I am not:

  • JavaScript passionate
  • UX Specialist
  • Cartographer, land surveyor

Definition of problem

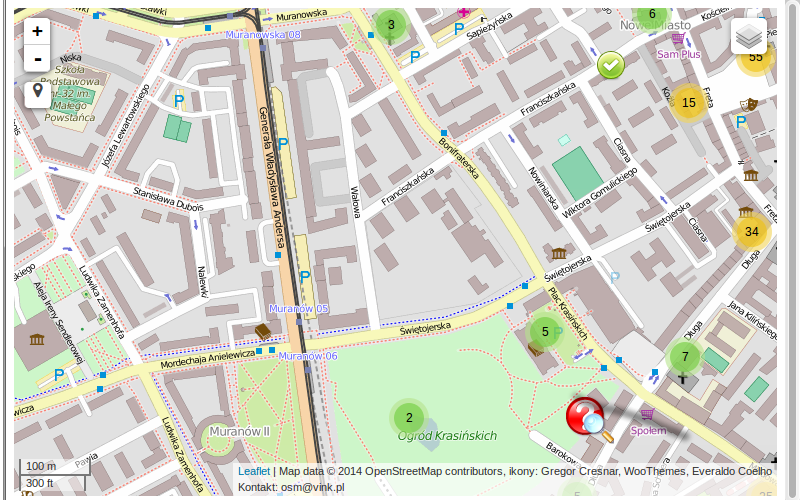
Where to go for a trip?
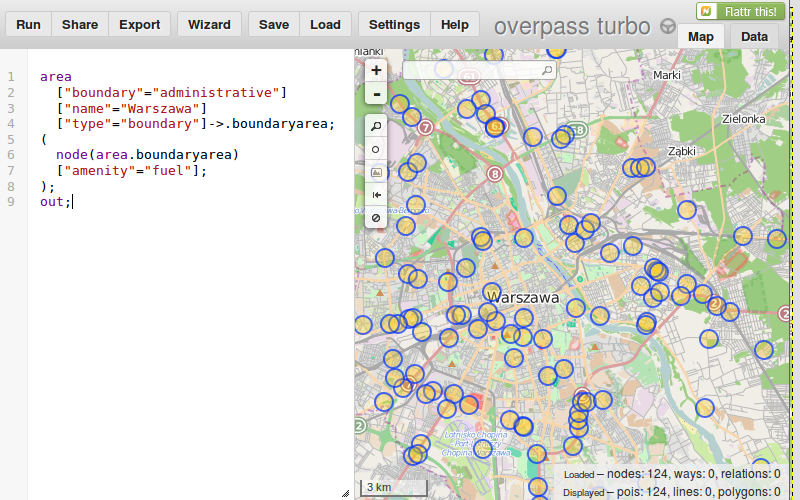
Constraints:

  • Within Poland
  • In rural areas
  • Intresting and fun

Solution:

Wiki Loves Monument contest

How does it look?

Lista Wikipedii

Impressed?

New problems:

Solution:

Own Map

Data sources:

Solution:

  1. Gather data Wikipedia (Python + BeautifulSoup)
  2. Gather data from OpenStreetMap (Overpass API, osmtogeojson)
  3. Gather data from Otwarte Zabytki (another Soup)
  4. Store data in Mongo Database)
  5. Analyze data (Python, Nominatim)
  6. Create a map (Leaflet JS and Python REST services)

Overpass / Overpass Turbo

Overpass API is a powerfull API to fetch data from OSM. Overpass Turbo - is an Overpass API integrated with a map for polishing your queries. Overpass database is optimized for quering. Results are returned as XML or as JSON. Query might be written using XML or QL language.
[out:json];
area
  ["boundary"="administrative"]
  ["name"="Warszawa"]
  ["type"="boundary"]->.boundaryarea;
(
  node(area.boundaryarea)
  ["amenity"="fuel"]; /* find fuel stations in Warsaw */
);
out;
            

Response data

                  {"type": "node",
                  "id": 81701702,
                  "lat": 52.2382697,
                  "lon": 20.9553151,
                  "tags": {
                    "amenity": "fuel",
                    "brand": "Bliska",
                    "fuel:biodiesel": "yes",
                    "fuel:diesel": "yes",
                    "fuel:octane_95": "yes",
                    "name": "Bliska",
                    "operator": "Orlen"
                  }},
            

Nominatim

Let's create the map

                var map = new L.Map('map', {
                    center: [52.232,21.021],
                    zoom: 13,
                    loadingControl: true,
                });
                var baseLayer = new L.TileLayer(
                        'http://{s}.tile.openstreetmap.org/{z}/{x}/{y}.png',  
                        { attribution: 'Map data © 2014 OpenStreetMap contributors',}
                );
                map.addLayer(baseLayer);
            

Add features / plugins

Why TileLayer

Advantages
  • To avoid loading all POIs (which is ~50MB of json)
  • It divides world into predefined tiles (22n for zoom level n)
  • Easy to cache (both by browser and Contend Delivery Networks)
Disadvantages
  • Data is not shared between zoom levels
  • Introduces layer of complication if you need to use marker clustering

Nice hacks

Nice hacks

Result

Result

Overpass example - OSM24.EU

Mapnik/Tile Mill example

Questions?

See you next month at WarsawJS